
Sales Process
Inbound Sales Metrics: The 15 Numbers to Track Before a Deal Reaches the CRM
Inbound sales metrics measure what happens between a visitor's first question and a booked meeting: how fast they got a reply, whether they were qualified, what they asked, how many became meetings, and what the rep received at hand-off. Most metric guides start at the CRM. ConnectLoop tracks the fifteen that come before it, because that is where inbound revenue is won or lost.

Published
Table of contents
- What are inbound sales metrics, and how are they different from pipeline metrics?
- Which inbound metrics matter most?
- Response metrics: how fast, and at what hours?
- Conversation metrics: what did they ask, and did it get answered?
- Qualification metrics: how many reached a scorecard?
- Conversion metrics: how many became meetings?
- Hand-off metrics: what did the rep receive?
- Call metrics: what happened after the hand-off?
- How do you calculate the core inbound sales metrics?
- What are good benchmarks for inbound sales metrics?
- Which metrics should a sales manager review weekly?
- How does ConnectLoop report inbound sales metrics?
- What are the most common mistakes in tracking inbound metrics?
- Key takeaways
- Frequently asked questions
What are inbound sales metrics, and how are they different from pipeline metrics?
Inbound sales metrics measure the stages that happen when the buyer starts the conversation: response time, conversation outcomes, qualification, booking and hand-off. Pipeline metrics measure what happens after a deal exists in the CRM: stage conversion, sales cycle length, win rate, average deal size, quota attainment. Both matter. Only the first set tells you why the second is what it is.
The distinction is where the data lives. Pipeline metrics come from the CRM, which only knows about a lead once someone created a record. Inbound metrics come from the conversations themselves: the website chat at 9pm, the WhatsApp message on Saturday, the email that arrived during a demo. A team that tracks only pipeline metrics is measuring the leads that survived, and averaging out the ones that didn't.
Call-centre KPIs sit somewhere in between. Answer time, average handle time, first-call resolution and CSAT are useful, and a sales team should borrow the first and third. What they miss is the sales outcome: a resolved conversation is not a qualified one, and a satisfied visitor who booked nothing is a lost lead with a good score.
| Metric family | Measures | Source of truth | Answers |
|---|---|---|---|
| Inbound sales metrics | First conversation to booked meeting | The conversations | Are we converting the people who came to us? |
| Pipeline metrics | Booked meeting to closed deal | The CRM | Are we closing the people we spoke to? |
| Call-centre KPIs | Speed and resolution per contact | Contact-centre software | Are we answering fast and fixing it first time? |
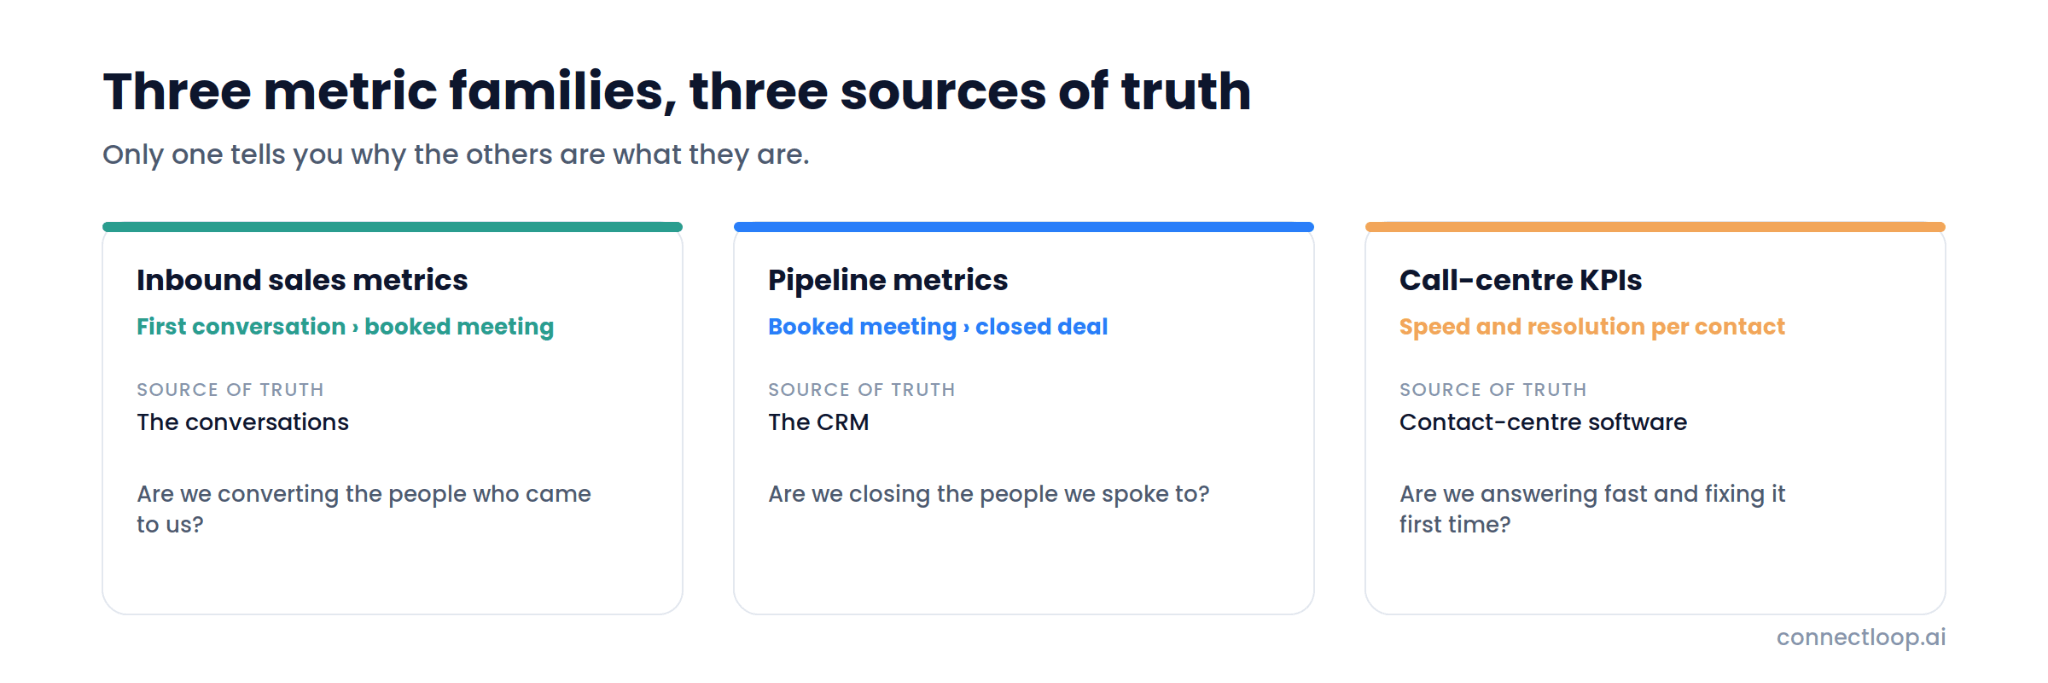
ConnectLoop's stages of the sales process guide maps which stages fall into each family; this article is about the first.
Which inbound metrics matter most?
Fifteen, in five families. Response metrics show whether the buyer got a reply and when. Conversation metrics show what they asked and whether it was answered. Qualification metrics show how many reached a scorecard. Conversion metrics show how many became meetings. Hand-off and call metrics show what the rep received and what they did with it.
| # | Metric | Family | What it tells you |
|---|---|---|---|
| 1 | Time to first response | Response | How long a buyer waited for a useful reply |
| 2 | After-hours share | Response | What proportion of enquiries arrive outside staffed hours |
| 3 | Unanswered enquiry rate | Response | How many enquiries never got a reply at all |
| 4 | Conversation drivers | Conversation | Why visitors reached out: pricing, features, setup, billing |
| 5 | Resolved-by-agent rate | Conversation | How often the first responder answered without a person |
| 6 | Knowledge gap count | Conversation | Questions the knowledge base couldn't answer |
| 7 | Friction rate | Conversation | Repeated questions, unanswered questions, long silences |
| 8 | Qualification completion | Qualification | Share of conversations that completed a framework step |
| 9 | Intent distribution | Qualification | High, Medium and Low intent as a share of identified visitors |
| 10 | Sentiment and escalation rate | Qualification | How often the mood turned and a person was needed |
| 11 | Conversation-to-meeting rate | Conversion | Conversations that ended in a booked meeting |
| 12 | Return-visit conversion | Conversion | Known leads who came back and re-engaged |
| 13 | Hand-off completeness | Hand-off | Whether the rep received transcript, score, scorecard and pages |
| 14 | Framework coverage | Call | Share of framework steps covered on the assisted call |
| 15 | Open action items | Call | Promises made on calls and not yet closed |
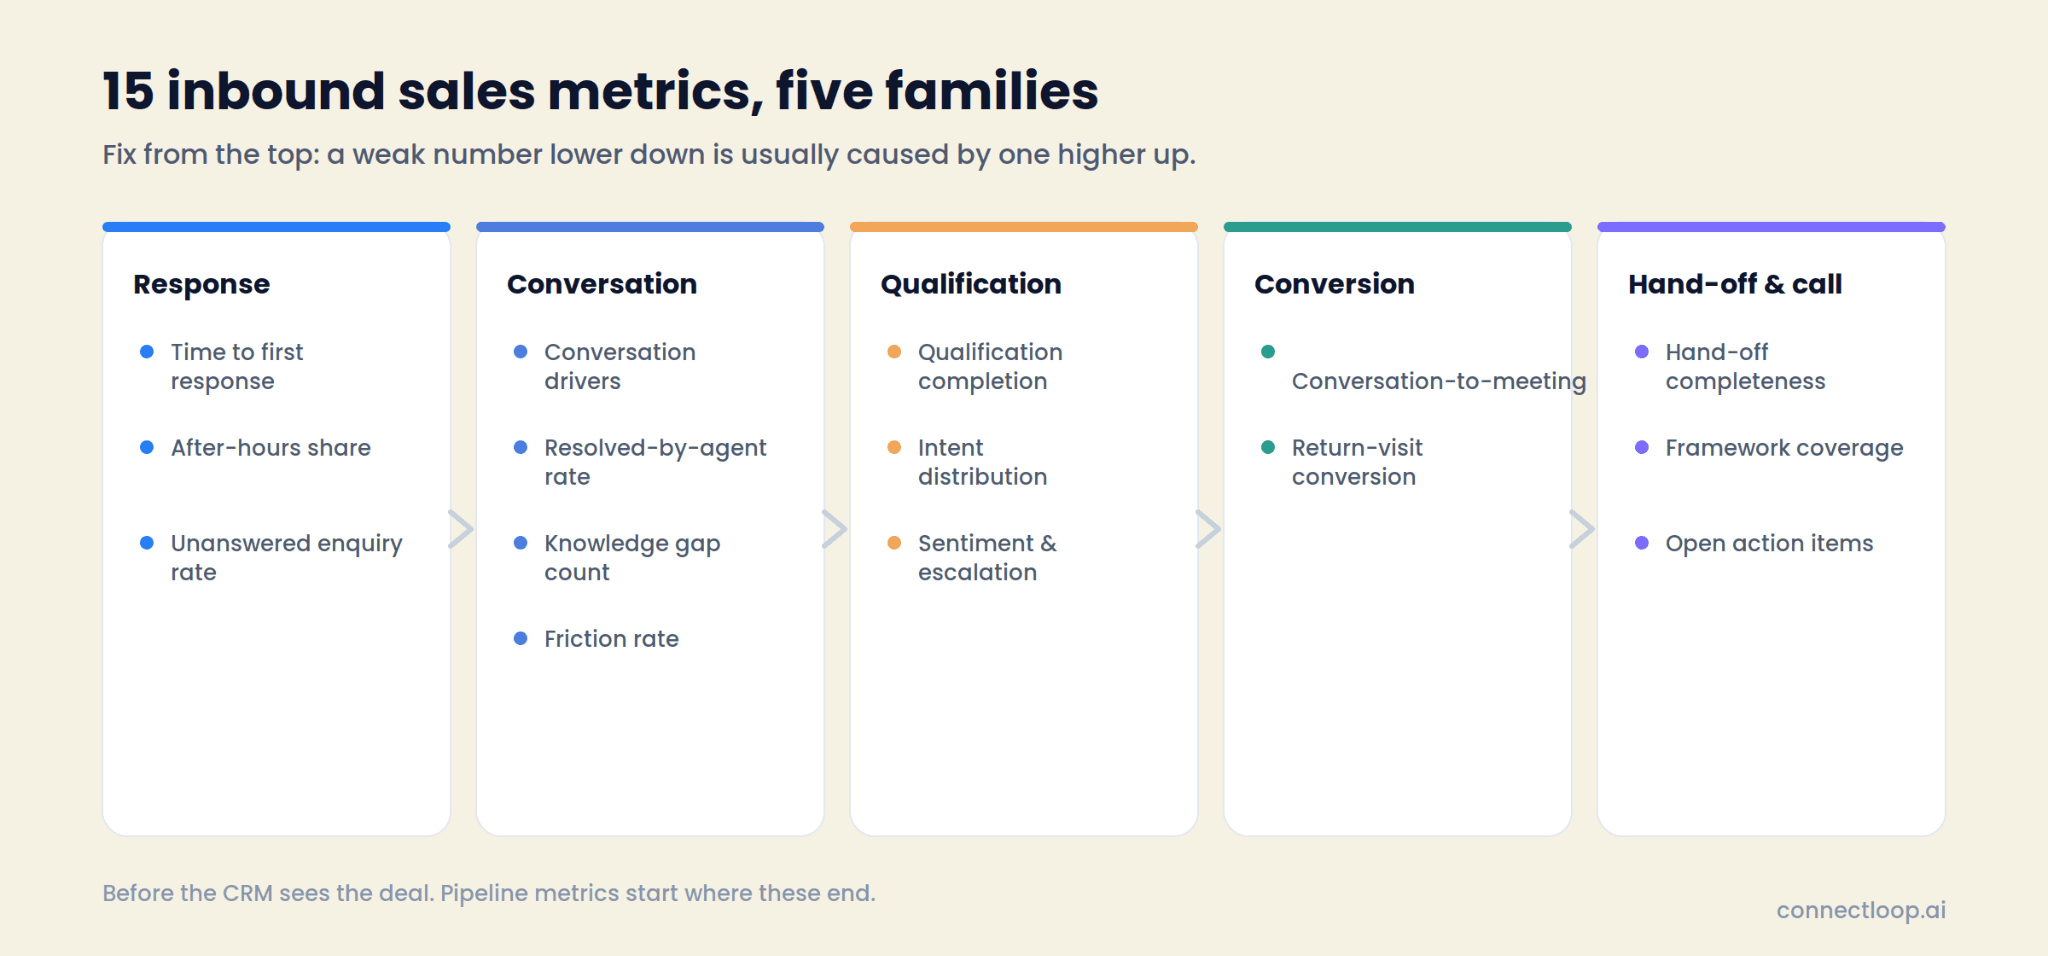
The order is deliberate. A weak number lower in the list is usually caused by a weak number higher up. Low meeting rate is often a response problem. Low qualification completion is often a knowledge gap problem. Fix from the top.
Response metrics: how fast, and at what hours?
Response metrics measure whether the buyer got a useful reply and how long they waited. They are the first thing to track because they are the first thing the buyer experiences, and they are the metrics most teams have never actually measured for the hours nobody was working.
Time to first response
Minutes from the buyer's first message to the first reply that answered it. Track it by hour of day and day of week, not as a single average; an average that blends 40-second weekday replies with 36-hour weekend replies tells you nothing. Call-centre practice uses an 80/20 rule, answering 80% of calls within 20 seconds, and for chat the equivalent expectation is an answer inside the first minute. ConnectLoop's speed to lead guide covers why the first minutes decide the deal.
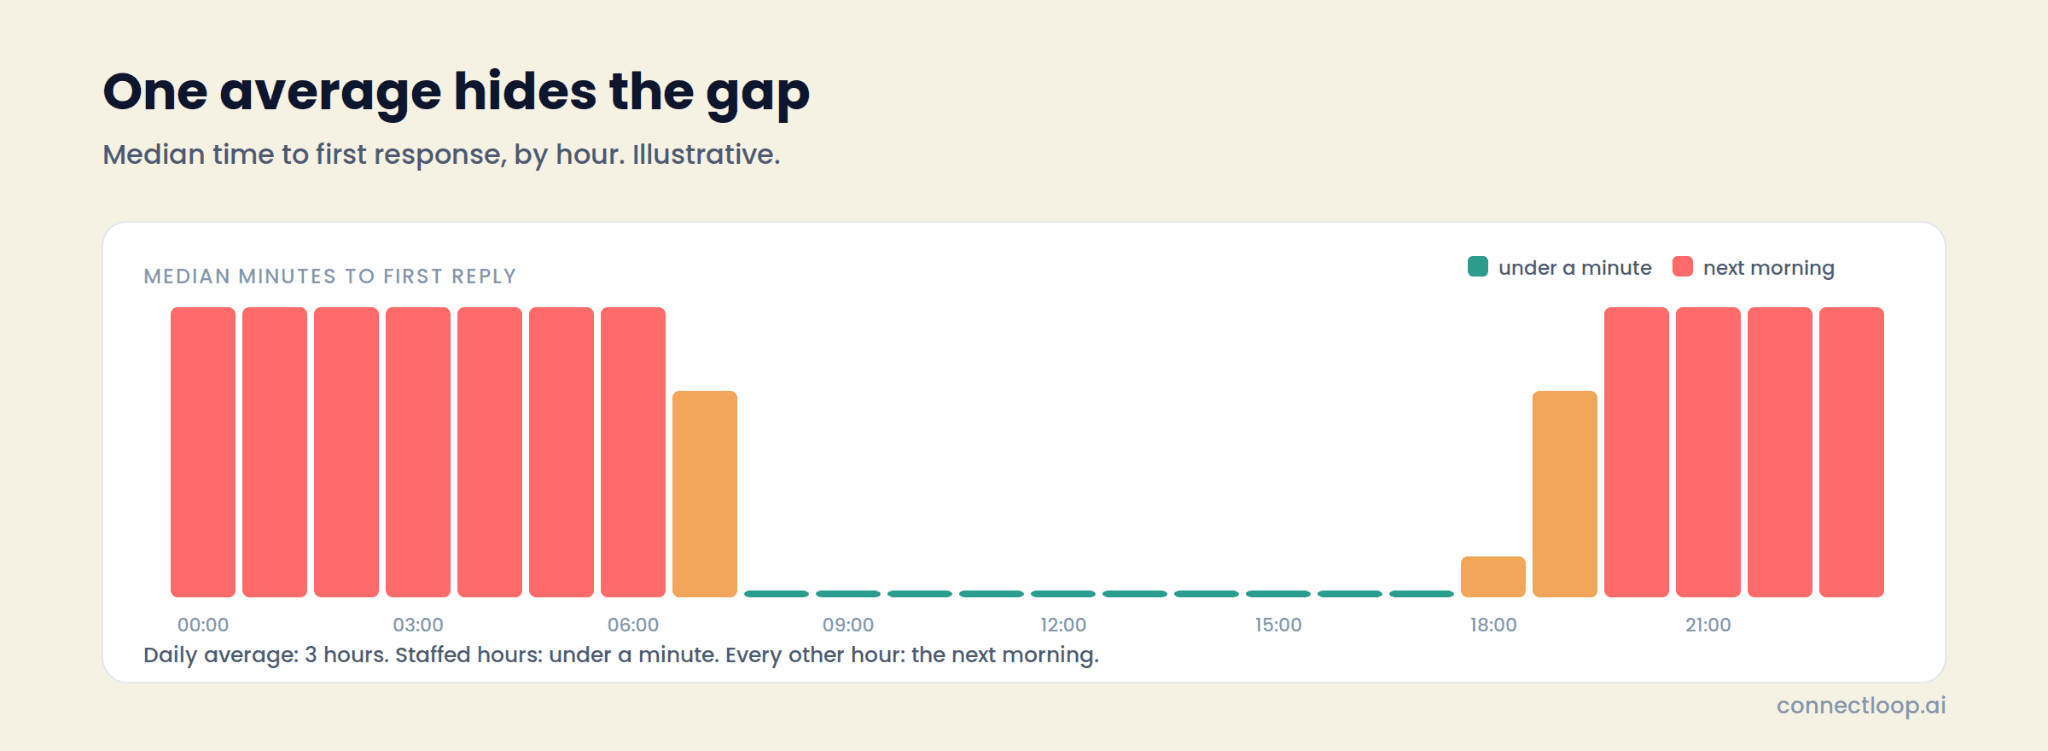
After-hours share
The proportion of enquiries that arrive outside the hours someone is available to reply. For education providers and services firms this is often the majority, because buyers research in the evening. It is the metric that decides whether an AI agent is a nice-to-have or the only way the enquiries get answered.
Unanswered enquiry rate
The share of enquiries, across every channel, that never received a reply at all. Not slow. None. Open the shared inbox, filter to last month, and count. Multiply by cost per lead. Most teams have never done this, and the number is always larger than expected. This is the metric that turns a response-time discussion into a budget discussion.
Conversation metrics: what did they ask, and did it get answered?
Conversation metrics group every inbound conversation by what drove it and measure whether the first responder resolved it. They are the diagnostic layer: they tell you which topic to fix, in which channel, before any qualification or booking metric can improve.
Conversation drivers
Why visitors reached out, as a share of all conversations: pricing, features, integrations, setup, billing, comparison with a competitor. This is the map of buyer intent in aggregate, and it is only available from a tool that reads every conversation rather than a sample of tickets. ConnectLoop's Conversational Intelligence reports it per period, with the trend against the previous one.
Resolved-by-agent rate
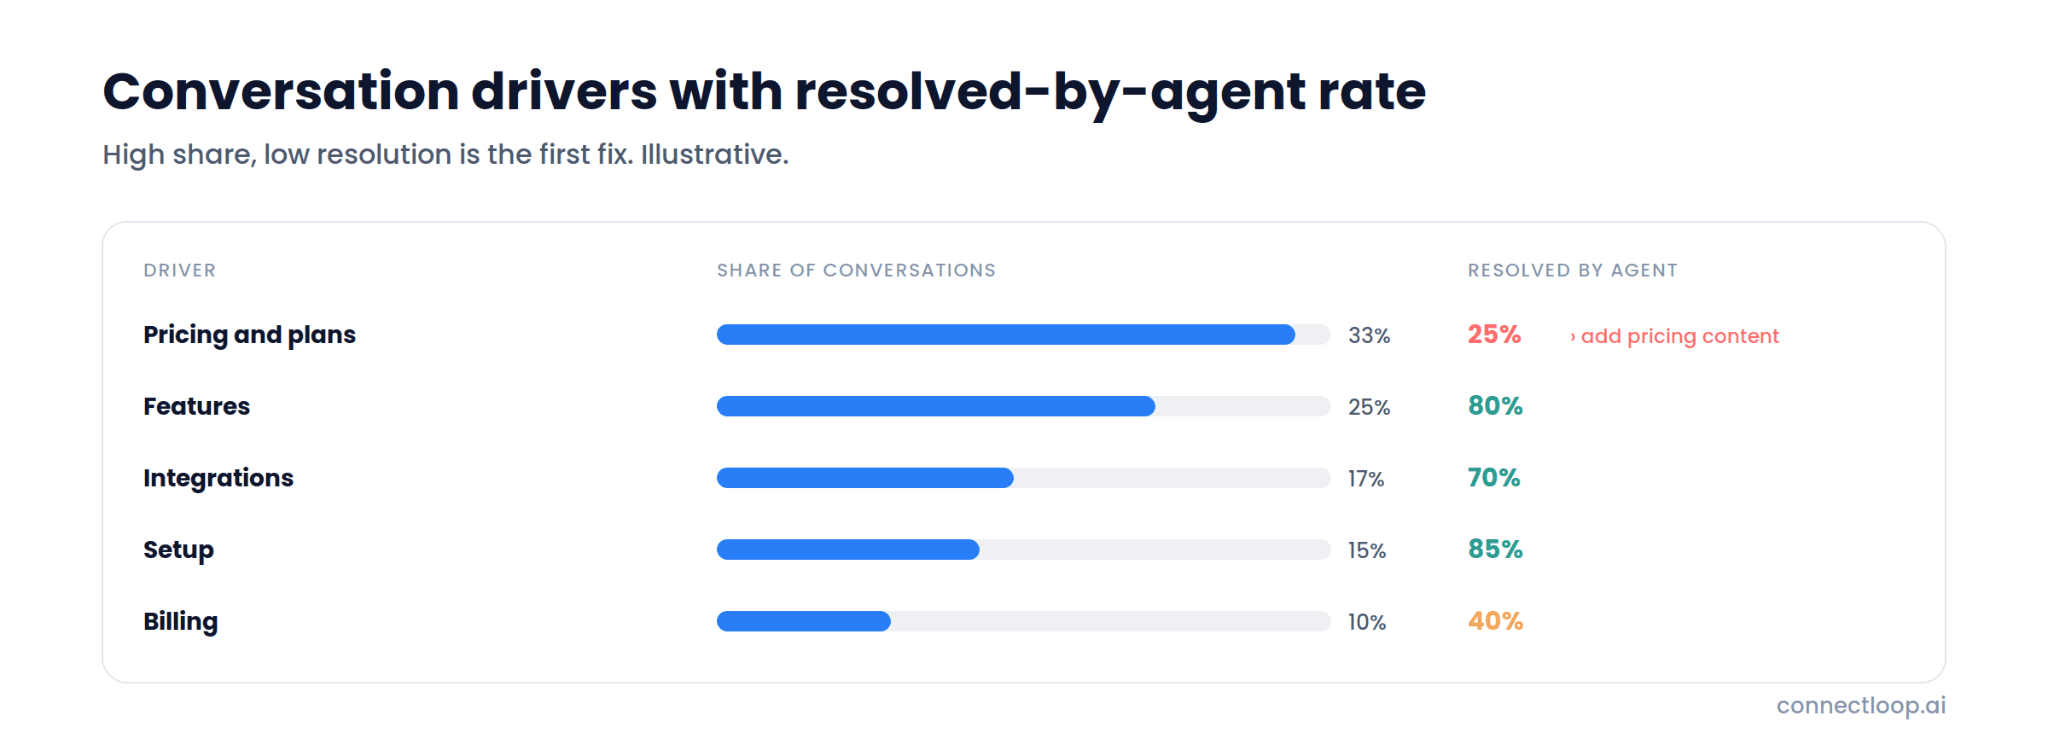
For each driver, how often the agent answered fully without a person stepping in. A driver with high share and low resolution is the highest-value fix on the list: pricing questions at a third of all conversations, resolved a quarter of the time, is a document waiting to be written. This is the sales version of first-call resolution.
Knowledge gap count
The number of distinct questions the knowledge base has not covered yet, logged as they occur. It is a queue, not a score: the goal is to work it to zero each week. ConnectLoop's Knowledge Gaps list holds each question with a status you mark Resolved once the content is added.
Friction rate
The share of conversations with a friction event: a question asked twice, a question left unanswered, or a long silence after a long reply. Each has a fix (add content, shorten answers, offer a next step) and each is visible per conversation, so the fix can be checked against the transcript.
Qualification metrics: how many reached a scorecard?
Qualification metrics measure whether the conversation produced evidence a rep can act on: which framework steps were completed, how intent was distributed, and how often the mood turned. They replace the vague "was this lead any good" with something checkable.
Qualification completion
The share of conversations in which at least one SPIN or MEDDICC step was completed, and the average number of steps completed per conversation. When Lia asks one question at a time and records each answer as Inferred or Confirmed, this becomes a real number: three of seven steps confirmed is early, not a failure. The inbound lead qualification guide explains the method.
Intent distribution
The share of identified visitors scored High, Medium and Low. The distribution matters more than any single score. A workspace where 23% are High is a different sales week from one where 5% are, and a sudden shift is an early signal that a campaign changed who is arriving. ConnectLoop's Intent Scoring shows the bands and the predicted reason each visitor reached out; the lead scoring guide covers what feeds the score.
Sentiment and escalation rate
The proportion of conversations that turned negative, hit a strong objection, or crossed the handover threshold, plus the share where the visitor asked for a person. Rising escalation with steady volume means the agent is hitting a topic it should hand over sooner. Falling escalation with rising friction means visitors are leaving instead of asking.
Conversion metrics: how many became meetings?
Conversion metrics measure the outcome the sales team cares about: conversations that ended in a booked meeting, and known leads who came back. These are the numbers to put on the wall, and the ones that improve only when the families above are healthy.
Conversation-to-meeting rate
Booked meetings divided by conversations, per channel and per period. Track it against the driver: a pricing conversation and a billing conversation should not be expected to book at the same rate. When booking happens inside the conversation, against a live calendar, this number becomes exact rather than estimated. ConnectLoop's AI appointment booking guide covers the mechanics.
Return-visit conversion
The share of known leads who came back to the site and re-engaged: opened the chat, replied to a follow-up, or booked. Proactive Outreach drafts an email on the return visit for a person to send; the metric is how many of those drafts were sent and how many led to a conversation. It measures whether the second touch is working, which most inbound reporting ignores entirely.
Hand-off metrics: what did the rep receive?
Hand-off completeness measures whether the rep's first call started with everything the conversation produced: the transcript, the qualification scorecard, the intent score with its reasons, the pages viewed, and the sentiment. It is a yes-or-no per lead, and a percentage across the team.
The reason to track it is that a hand-off with only a name and email erases everything the earlier metrics measured. If qualification completion is 60% but hand-off completeness is 20%, the rep is re-asking what was already answered. ConnectLoop writes the full record to HubSpot, Salesforce, Zoho or Pipedrive, so the check is whether the sync is on and the fields are mapped.
Call metrics: what happened after the hand-off?
Call metrics measure the assisted call itself: how much of the framework was covered, and what was promised. They close the loop from first message to rep, and they are the metrics that make coaching specific.
Framework coverage
The share of framework steps marked covered on each call, with the buyer's quote as evidence, averaged across the team and broken down by framework. A step the whole team skips is a step to rewrite. ConnectLoop's Sales Assistance scores this automatically after every assisted call and shows the average on its dashboard beside calls assisted and cues accepted.
Open action items
Promises made on calls and not yet closed, with how overdue each is. It is the simplest predictor of a deal going quiet: a commitment the rep forgot is a reason the buyer stopped replying. The customer dossier lists them per account, and the dashboard totals them per period.
How do you calculate the core inbound sales metrics?
Most inbound metrics are a count divided by a count, over a fixed period, by channel. The formulas below use a 30-day window and treat "conversation" as any exchange with at least one visitor message and one reply.
- Time to first response = median minutes from first visitor message to first substantive reply, reported by hour of day. Use the median; the mean is dragged by weekends.
- After-hours share = enquiries arriving outside staffed hours ÷ all enquiries × 100.
- Unanswered enquiry rate = enquiries with zero replies ÷ all enquiries × 100.
- Resolved-by-agent rate = conversations on a driver resolved without a person ÷ all conversations on that driver × 100.
- Friction rate = conversations with at least one friction event ÷ all conversations × 100.
- Qualification completion = conversations with at least one framework step completed ÷ all conversations × 100.
- Conversation-to-meeting rate = meetings booked ÷ conversations × 100, by channel.
- Return-visit conversion = known leads who re-engaged after a return visit ÷ known leads who returned × 100.
- Hand-off completeness = leads whose CRM record carries transcript, score, scorecard and pages ÷ leads handed to a rep × 100.
- Framework coverage = steps marked covered ÷ steps in the framework × 100, per call, then averaged.
Two rules. Segment by channel before comparing, because website, WhatsApp and email behave differently. And report each metric against its previous period, because the direction matters more than the level.
What are good benchmarks for inbound sales metrics?
Benchmarks for inbound sales metrics are mostly internal, because the right number depends on deal size, channel and buyer. Use your own previous period as the benchmark, and treat the external rules of thumb below as a starting line rather than a target.
| Metric | Starting line | What "good" looks like for an inbound team |
|---|---|---|
| Time to first response | Under a minute in chat during staffed hours | Under a minute at every hour |
| After-hours share | Measure it; most teams guess low | Known, and covered |
| Unanswered enquiry rate | Anything above zero is a leak | Zero across all channels |
| Resolved-by-agent rate | Varies by driver | Rising period over period on the top three drivers |
| Friction rate | Falls as the knowledge base grows | Under 10% and falling |
| Qualification completion | Depends on framework depth | Majority of conversations with at least one step confirmed |
| Conversation-to-meeting rate | Varies widely by channel and driver | Rising, with pricing and comparison drivers above the average |
| Hand-off completeness | Often near zero without a sync | Near 100% once CRM sync and tags are set |
| Framework coverage | Low on the first assisted calls | Rising, with the skipped step identified and fixed |
The honest benchmark for the whole family is one question: of the people who came to us last month, how many did we speak to, qualify and book? If you can answer it from a dashboard rather than a spreadsheet, the metrics are working.
Which metrics should a sales manager review weekly?
Five, in ten minutes: unanswered enquiry rate, time to first response by hour, conversation-to-meeting rate by channel, top three drivers with their resolved-by-agent rate, and framework coverage with the most-skipped step. Everything else is monthly or on demand.
- Unanswered enquiries. Should be zero. If it isn't, nothing else this week matters more.
- Response time by hour. Look for the hours where the median jumps. That is where coverage is missing.
- Meetings per conversation, by channel. The outcome number, split so a WhatsApp change doesn't hide a website problem.
- Top drivers and resolution. Which topic is growing, and is the agent handling it. One knowledge base addition per week is the cadence.
- Framework coverage and the skipped step. The coaching input. A step everyone skips is a framework problem, not a rep problem. ConnectLoop's benefits of sales coaching guide covers how to use it.
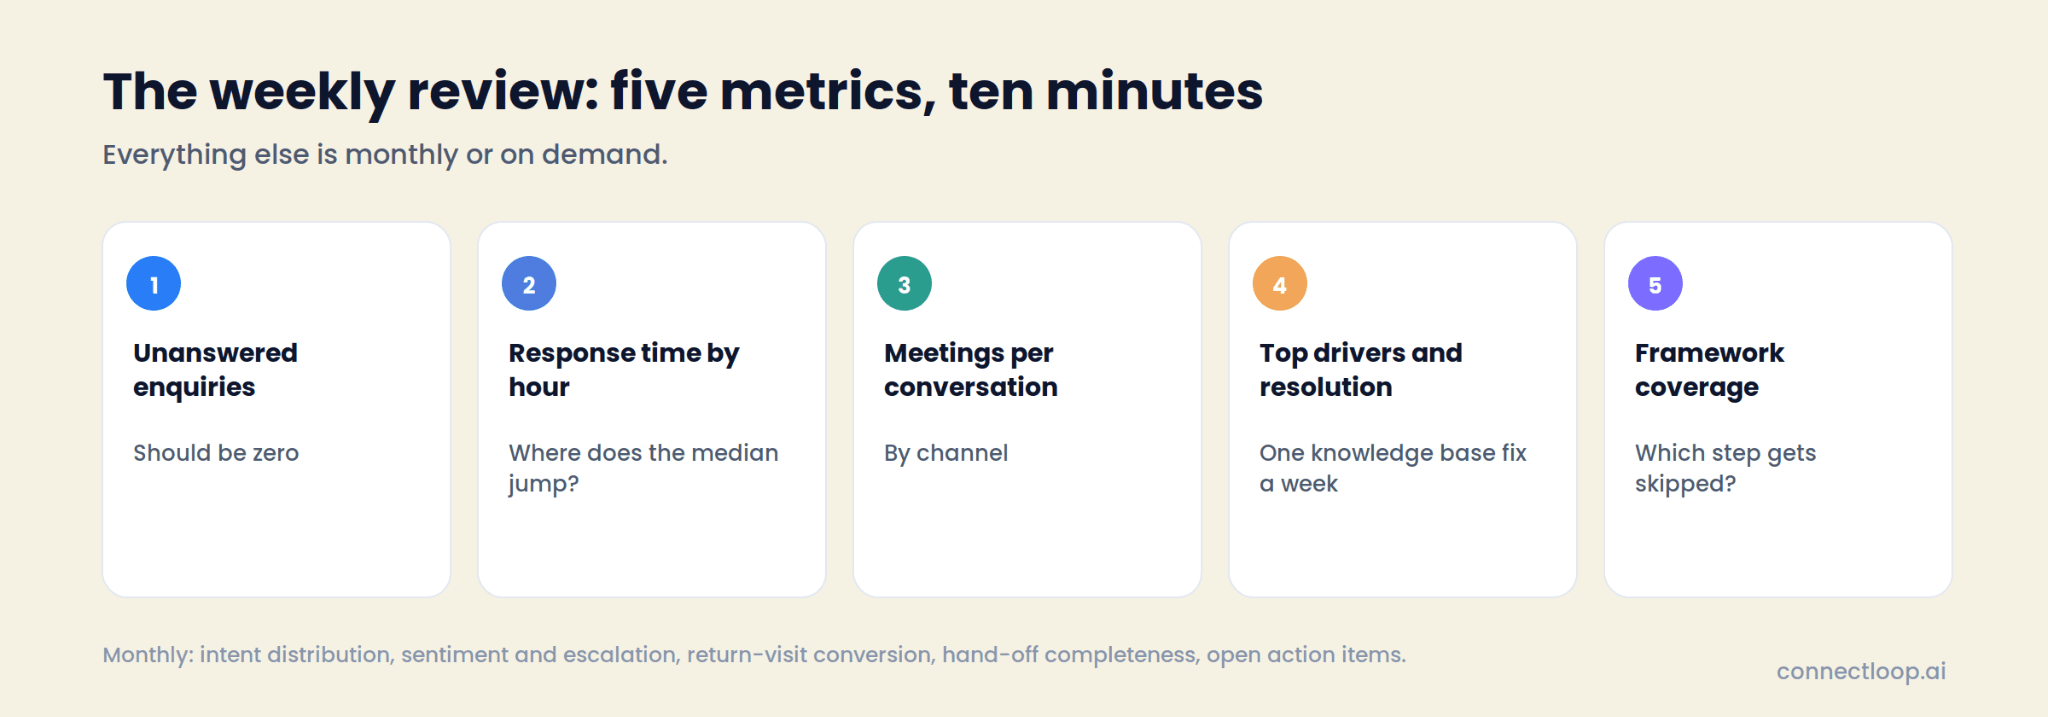
Monthly: intent distribution, sentiment and escalation, return-visit conversion, hand-off completeness, open action items.
How does ConnectLoop report inbound sales metrics?
ConnectLoop reports the fifteen metrics from three screens, each reading the conversations directly rather than a sample: Conversational Intelligence for the response, conversation and qualification families; the leads and appointments views for conversion; and the Sales Assistance dashboard for call metrics. All with a 7, 30 or 90-day range.
Conversational Intelligence. The Overview shows conversations analysed, average intent, average sentiment, high-intent visitors and friction events, with a written summary of what changed this period. Conversation Drivers shows share and resolved-by-agent rate per driver with a recommendation where resolution is weak. Friction Points ranks the three friction types with the exact conversations behind each. Sentiment shows the trend against the handover threshold and lists frustration and escalations. Intent Scoring shows the High, Medium and Low distribution with the predicted reason per visitor.
Knowledge Gaps. Every question the training content has not covered yet, with a Resolved or Ignored status. The count is the metric; the list is the to-do.
Leads and appointments. Every conversation tracked from first message to booked meeting, with lead temperature and the AI's reasoning on each record, and calendar bookings listed against them. Conversation-to-meeting rate is a division of two numbers on the same screen.
Proactive Outreach. Drafts created on return visits, with Sent and Dismissed status per lead, which is the return-visit conversion metric in its raw form.
Sales Assistance dashboard. Calls assisted, cues accepted, average framework coverage and open action items, with a per-framework breakdown, score distribution, recurring customers and a by-rep table. The customer dossier holds open promises per account.
What the team still decides is what to do with the numbers. The dashboard shows that pricing questions resolve a quarter of the time; a person writes the pricing document. It shows that the Commit step is skipped on most calls; a manager rewrites the step's wording. The metrics point; the team acts.
What are the most common mistakes in tracking inbound metrics?
The common mistakes are averaging response time across all hours, measuring resolution instead of outcome, counting leads only once they reach the CRM, tracking a single channel, and treating a good score as a good result. Each hides a leak.
- One average for response time. A 40-second weekday median and a 36-hour weekend median produce a meaningless mean. Fix: median by hour of day.
- Resolution as the goal. A resolved conversation that booked nothing is a satisfied lost lead. Fix: pair resolved-by-agent rate with conversation-to-meeting rate.
- Counting from the CRM. The CRM only knows the leads that survived. Fix: count from the conversations, including the ones that ended at the first reply.
- One channel. Website chat, WhatsApp and email have different response expectations and different meeting rates. Fix: segment everything by channel.
- Scores without outcomes. A High-intent distribution is only useful if High-intent leads book more. Fix: check conversation-to-meeting rate by intent band.
- No hand-off check. Qualification that never reaches the rep is wasted. Fix: track hand-off completeness as a percentage.
- Vanity totals. Conversations handled, messages sent, visitors tracked. None of them is a sales metric. Fix: every number on the weekly review should be a rate or a queue.
Key takeaways
- Inbound sales metrics measure the stages before the CRM: response, conversation, qualification, conversion, hand-off and call. Pipeline metrics measure what comes after.
- Fifteen numbers in five families; fix from the top, because a weak number lower down is usually caused by one higher up.
- Unanswered enquiry rate and time to first response by hour are the two most teams have never measured and the two with the largest hidden cost.
- Resolved-by-agent rate per driver is the inbound version of first-call resolution and the fastest route to a better knowledge base.
- Qualification completion and intent distribution replace "was the lead any good" with evidence from the conversation.
- Conversation-to-meeting rate by channel is the outcome number; hand-off completeness is what stops it being wasted.
- Framework coverage and open action items close the loop on the rep's call.
- Review five weekly in ten minutes; segment everything by channel; use the previous period as the benchmark.

About the author
ConnectLoop Staff
Written by the ConnectLoop team. ConnectLoop is an AI sales agent for inbound revenue teams, based in Cambridge, Massachusetts.
About ConnectLoop →Frequently asked questions
Unanswered enquiry rate, because it is the one most teams have never measured and the one with the largest hidden cost. After it is zero, conversation-to-meeting rate by channel becomes the number to run the week on.
A metric is any number you track. A KPI is the handful you manage to. For an inbound team the KPIs are usually time to first response, conversation-to-meeting rate and framework coverage; the other twelve are diagnostics that explain movement in those three.
Under a minute, at every hour the enquiry can arrive. During staffed hours a human can hit that; outside them it takes an agent. Measure the median by hour of day rather than a daily average, so the gaps show.
By qualification completion and intent distribution: how many conversations completed a framework step with a confirmed answer, and what share of identified visitors scored High. Both come from the conversation, not from a form field, which is what makes them checkable.
For each reason visitors reach out, the share of conversations the AI agent answered fully without a person. It is the inbound equivalent of first-call resolution, and a low rate on a high-share driver is the fastest knowledge base fix available.
Yes, always. Website chat, WhatsApp and email attract different questions at different hours with different expectations. A blended number hides which channel changed. ConnectLoop reports every metric with the channel as a filter.
Conversation-to-meeting rate is the bridge: the meeting is the first pipeline stage. Everything above it explains how many meetings there were; everything below it, in the CRM, explains how many closed. Read the two together and stage-one conversion stops being a mystery.
Five weekly, in ten minutes: unanswered enquiries, response time by hour, meetings per conversation by channel, top drivers with resolution, and framework coverage. The rest monthly, and any of them on demand when a number moves.
Partly. Response time, unanswered rate and meetings per conversation can be counted by hand from an inbox and a calendar, slowly. Drivers, resolution, friction, qualification completion and intent distribution need a tool that reads every conversation, which is what Conversational Intelligence does.
If your reporting starts at the CRM, it starts after the leak
ConnectLoop tracks every conversation from the first message on website, WhatsApp or email to the booked meeting and the assisted call, and reports the fifteen metrics above from the conversations themselves. Train Lia on your site in about a minute on the free plan, turn on Conversational Intelligence, and read the first period's numbers.